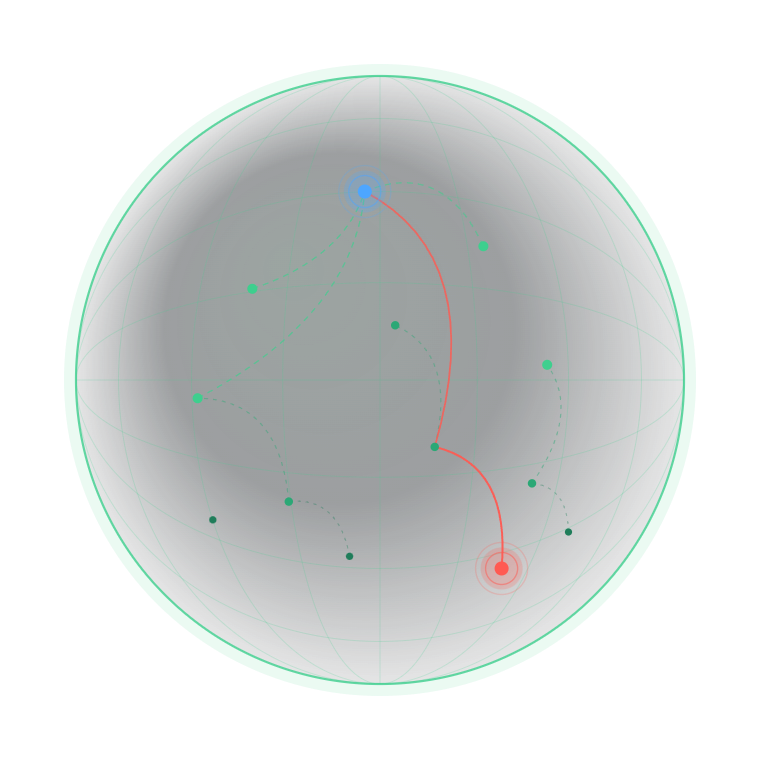
initializing supply exposure map…
TIERISK
Upstream exposure · illustrative
100%
Supply integrity
0%
Value at risk
Your operations
Tier‑1 · known
Tier‑2 · inferred
Tier‑3 · low confidence
Disrupted · cascading

Risk hides upstream.We warn you first.

TIERISK reconstructs the hidden upstream graph behind your line — Tier‑2 through Tier‑3 — and turns planetary‑scale noise into the few warnings that actually reach you.

Illustrative exposure model
Most disruptions originate beyond your direct suppliers — in the tiers you can't see.
Inferthe hidden Tier‑2–3 graph from open data
Scoreevery inferred link against its evidence
Warndays before a cascade reaches your line
Sovereign · runs inside your own cloud
scroll
01 — The fog of procurement

Tier-N supplier risk. One massive blind spot.

Your direct suppliers are the part you can see and govern. The exposure that actually stops your line sits two, three, four tiers upstream — where you hold no contract, no audit right, and no map.

Tier · 01

Direct suppliers

Tier-1 direct supplier intelligence. Audited. Contracted. Named. Fully visible — and the part everyone already watches.

Tier · 02

Suppliers of suppliers

Rarely audited. Semi-visible at best, built on assumptions you can't verify.

Tier · 03+

The fog.

No contract. No audit. No line of sight. Every disruption starts here — and almost nobody monitors it.

Illustrative scenario · Taiwan

A factory they'd never heard of. Production halted.

A Tier‑2 chemical supplier in Hsinchu goes down. Four days pass before the OEM connects the outage to a line-stop. Nine lead-time days, gone — to a name that was never on any chart they owned.

TierT‑2 · Chemical
Impact+9 days lead
DetectedDay 0 → Day +4
Could have beenDay −7
02 — The strategic shift

From Just‑in‑Time to upstream tier risk mapping.

The same upstream event, two outcomes. Reactive reporting tells you after the buffer is gone. Anticipatory intelligence hands you the days back — before the trough.

Standard JIT
+9D
lead loss · reactive
TIERISK radar
D−7
early signal · buffer deployed
From reactive reporting → anticipatory intelligence.
03 — Predictive impact curves · illustrative

Probabilistic exposure scoring. −32% for 11 days.

TIERISK is built to compile every signal into a quantified production curve — lead-time forecasting, trough depth, recovery slope — so you plan inventory, not panic. The output is a decision, traced to its evidence.

Illustrative model · sample scenario
N‑07 Chemical · Hsinchu · T2● RED · 0.91
BASELINE OUTPUT −32% · TROUGH D+6 RECOVERY D+18
−32%
Trough
11 days
Duration
D +18
Recovery
Signal →
T‑2 Chemical · Hsinchu. Grid + field evidence flags a capacity outage.
Infer →
−32% output · trough D+6 · recovery D+18, scored on calibrated belief.
Action →
Pre‑build +14d · shift 15% to an alternate node before the line feels it.
04 — Signal taxonomy

9 classes. Multi-tier visibility. 1 output.

Different risks move at different speeds, so we ingest them at different cadences — from minute-by-minute ambient evidence to quarterly structural shifts — and resolve all of it to a single decision: one supply chain disruption prediction.

Layer 01 · Structural
Quarterly → weekly
Authoritative
01
Geopolitical
Sanctions · export controls · chokepoint centrality
02
Financial
Credit stress · layoffs · CapEx · FX shocks
03
Regulatory
Emissions drift · closures · tariff escalation
Layer 02 · Operational
Daily → hourly
Field evidence
04
Labor
Union activity · overtime chatter · shortfalls
05
Logistics
AIS vessel delays · congestion · re-routes
06
Weather
Floodplain recurrence · heat · storm path
Layer 03 · Ambient
Minute-by-minute
Evidence-linked
07
Cyber
Ransomware leaks · dark-web · ERP outages
08
Calendar
Lunar New Year · elections · harvest cycles
09
Sentiment
Trade-press · worker forums · local media
Deterministic filter → embedding → LLM-as-judgeevidence trace
05 — Competitive moat

Upstream tier risk mapping. We warn you early.

Incumbents map tiers, score vendors, or summarize events — as multi-tenant SaaS that ingests your graph. TIERISK runs sovereign, infers deeper, and shows its work.

TIERISK
Sovereign · private cloud
Logistics-first
monitoring SaaS
Tier-mapping
SaaS
Risk-scoring
SaaS
ESG / NLP
alerting SaaS
DeploymentPrivate cloud · graph stays in VPCSaaSmulti-tenantSaaSmulti-tenantSaaSmulti-tenantSaaSmulti-tenant
Tier-N visibilityTier‑1 → 3 · chokepointsTier‑1 → 2Tier‑1 → N · slowerScore-basedTier‑1 direct
ExplainabilityEvidence traceEvent summariesEvent summariesOpaque scoringNews excerpts
OutputDecision-grade callsRisk reportsTier-N mapsRisk scoresESG alerts
Enterprise supplier risk monitoring — comparison of architectural approach and deployment model — not independently benchmarked performance.
06 — The sovereign stack

Sovereign supply chain intelligence, for the CISO who can't say yes to SaaS.

If your supplier structure is itself sensitive, a tenant that ingests your bill of materials is a non-starter. TIERISK runs inside your boundary, under your governance — the inference comes to the data.

01
Sovereign
Private VPC · zero egress · on-prem LLM
02
Explainable
Every score → source · no black box
03
Auditable
Hash-pinned evidence · signed ledger
Architected to satisfy SOC 2ISO 27001DPDP GDPRCERT‑INSTQC
// Customer boundary · no graph egress
L·01
Enterprise supplier graph
m‑BOM · contracts · Tier-N chain
L·02
TIERISK inference plane
Private endpoints · no telemetry
L·03
Signal router · cost-aware
Open-source vs frontier LLM
L·04
Evidence ledger
Hash-signed · append-only
✕ Graph egress blocked at boundary
07 — The decision cockpit · illustrative

Real-time alerts, geopolitical risk, on one surface.

One surface. Every supplier. Every decision. The cockpit turns 11,842 daily signals into the handful of calls that actually move your buffer — each one scored, evidenced, and ready to execute. Supply chain continuity management, run forward: anticipatory intelligence rather than reactive reporting.

Illustrative cockpit · sample data, not live
247
Monitored
live portfolio
1
Red · divert
urgent action
2
Amber · act
dual-source
244
Green
nominal
−9.2d
Lead-time Δ
vs 30d baseline · modeled
$118M
Avoided impact · modeled
revenue at-risk
11,842
Signals · 24h
→ 18 decisions
0.91
Top conf.
Hsinchu Fab-07
In supply chains, delay is expensive. Surprise is disruptive. Hindsight is existential.
We replace all three with foresight.
Sovereign intelligence Explainable by design Decision-grade
Request access

Tell us about your operations.

If tier-N supplier risk visibility is something you're being asked to answer for, send a few lines about your supply chain and we'll come back to you directly. We work with a limited number of design partners — your message reaches the founding team, not a queue.

We work with a limited number of design partners. Your message reaches the founding team, not a queue.
Request received.

Thanks — we read every one of these ourselves. If there's a fit with the current cohort, you'll hear back from the founding team directly, usually within a couple of working days.

Globe configuration